


EOE Report on the Improvement of the Wetness Index in Discharge Models along the Upper Mekong River
- Jun 8, 2021
- 7 min read
Updated: Jun 9, 2021

Alan Basist and Claude Williams,
June 9, 2021
After the publication of our initial study “Monitoring the Quantity of Water Flowing through the Upper Mekong Basin under Natural (Unimpeded) Conditions” in April 2020, we have reviewed and evaluated feedback from published articles offering criticism and suggestions of improving the results of our study and the underlying processes which delivered those results. Specifically, the increasing negative residual values over time in our originally published natural flow model, particularly over the last six years of the model’s data have concerned us. This has led to a very large deficit of “missing water” if true. After testing numerous theories and accounting for nearly all possible forms of physical water missing from the basin (evaporation, local use for agriculture, inter-basin diversion, etc.) we have come up with the following conclusions described below and adjustment to the process which informs our results.
In our previously published study we generated a river flow model based on a satellite derived wetness index was used to predict discharge from the Upper Mekong Basin (UMB). Surface wetness values averaged throughout the UMB were correlated on the monthly mean gauge observations to develop a regression flow model. It has a quadratic functional form and relies on the assumption that wetness upstream leads the response at the gauge. Calibrated on the years 1996 through 2001, the regression model explained 91% of the variability in water flow past the Chiang Saen gauge. When reviewing the residuals in the recent years, the difference between the gauge measurements and predicted flow showed increasing larger amounts of predicted water, relative to the gauge measurements. The difference field is portrayed by the green line in the plot below. Whereas the black line is the gauge measurements, and the red is the predicted natural flow. Initially we ascribed the lack of water at the gauge to the impediment of water in the major reservoirs constructed in the upper basin over the past decade.
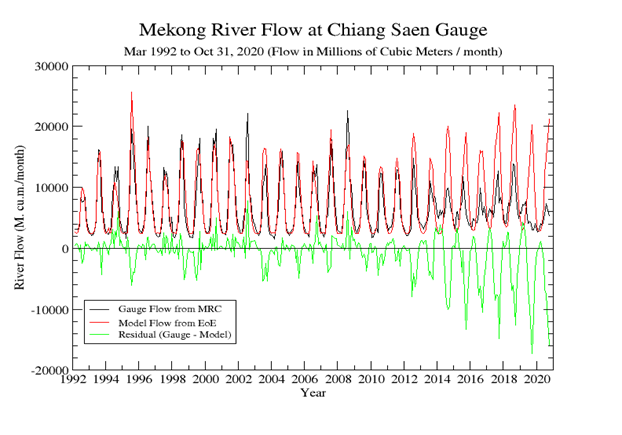
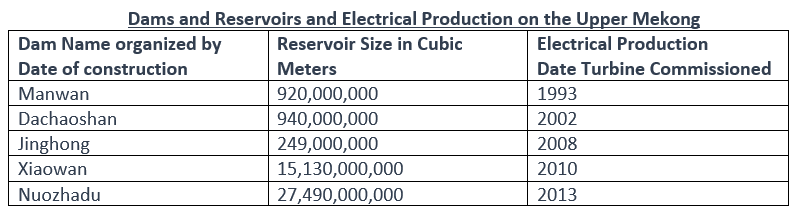
An investigation questioned whether the differences in flow was caused by the restriction of water contained by major and dams and reservoirs. Specifically, the Nuozhadu and Xiaowan mega-dams were associated with the lack of water downstream (see table below for the size of those two reservoirs). However, after further consideration, it was evident that the dams and reservoirs could not restrict the quantity of water missing in the model prediction both over time and during certain years in the model. We began to investigate the source of the bias in the model prediction in the latter years of the time series of flow at Chiang Saen (located at the intersection of Thailand, Laos, and Myanmar).
Therefore, we performed several analyses to identify the potential source of the error. The research revealed that a drift in overpass could be the cause, since the morning passes of the current satellite was drifting earlier in the morning, past the terminator (sunrise). Specifically, the time series of the wetness index has been derived from multiple operational satellites with the same, or very similar instrumentation. When intercalibrated and added together, they produce our products for the period of record (1992 to current) around the world. We attempt to use operational satellites that have similar overpass, that generally correspond with a 06:00 and 18:00 equatorial overpass time. However, the satellite that we were using operationally in 2016 (designated F17) experienced channel measurement failures, which diminishes our opportunity to use the satellite operational from 2016 to the present. Therefore, the F18 satellite platform was calibrated and its data added to the series starting in 2016.
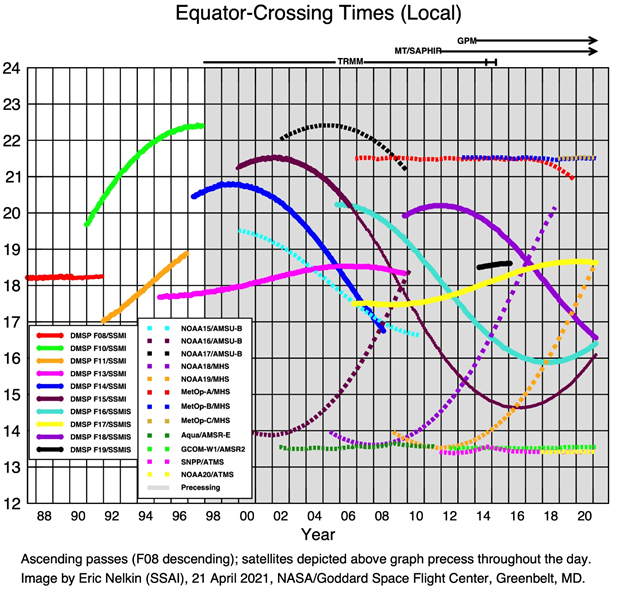
The plot below (generated by NASA) illustrates the overpass times of all the microwave satellite instruments since 1988. We used the F11 for operations from 1992 to 1995 (orange) then the F14 for operations from 1996 to 2008 (light purple) then the F17 for operations from 2008 to 2016 (yellow). Currently we are operationally using the F18 (dark purple) to observe the wetness values at the surface. You can notice that the overpass time of the F18 is drifting earlier and earlier in the morning, starting near 6:30 AM/PM local time in 2016 to about 4:30 AM/PM local time currently. Previous research has demonstrated that the magnitude of morning dew on the surface does have a significant impact on the wetness index, since the product is highly sensitive to liquid water from all sources (soil moisture, water in the canopy, melting snow cover, bogs, dew, etc.).
We were concerned there could be an increase of wetness in the early morning hours observations (when there is a higher likelihood of dew on the surface). This is particularly true, if the earlier overpass time would register an increase in wetness. We also expected these biases would be a function of the annual cycle of the sun. Since the sun rises early in the summer and later in the winter. Therefore, we looked at the trend (and potential bias) for the wetness values at different months of the year.

Comparing the plots above and below, starting in 2016, it is evident there is an increasing trend in wetness during in the shorter daylight season (above) and no increase trend in the longer daylight season (below). The sun rises later in the morning in February, allowing the satellite to pass overhead at a time when the dew remains on the surface. In the plot above the wettest years on record began 2016 (when the overpass began to occur earlier each year). The time of observation bias is less evident in the long daylight season, when the sun rises earlier in the morning. The dew evaporates from the surface before the satellite flies overhead. This provided insight that excess surface wetness in the early morning introduced a considerable wet bias during a major portion of the year.

Therefore, we removed the descending mode (morning observations) from the product. The new product now contains daily observations from the ascending mode (afternoon overpass) only. There is no significant time of observation bias (i.e. change in the observed wetness) between 6:30 p.m. and 4:30 p.m. overpass time of the satellite. This did remove half of the observations and some accuracy in the wetness product. However, removing the morning bias was much more beneficial, than retaining degrees of freedom (number of observations) and retaining bias observations in the analyses.
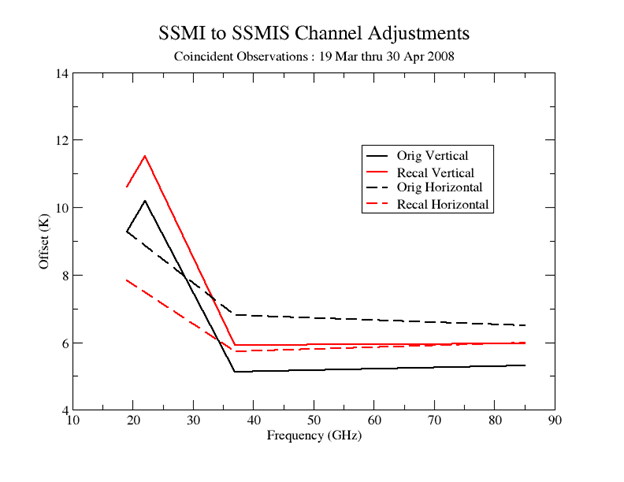
The next step to improving the product was to revisit the inter-satellite calibration. Specifically, to minimize the seam between stitching observations from the F13 satellite platform, which we used from May of 1995 to March 2008 to the F17 we started to use operationally in April 2008. Moreover, The F13 satellite observes frequencies 85 GHz frequency, whereas the F17 instrument has observations at 91 GHz frequency. When a time series goes from one instrument to another, particularly changing the frequency of observation, an accurate inter-calibration between satellites is essential. We initially inter-calibrated with antennae temperatures provided by NOAA. But a more quality controlled dataset of only brightness temperatures processed by NASA replaced the NOAA data, so the inter-calibration needed fine tuning, since brightness and antenna temperature are different. The plot above shows how the inter-calibration values changed at various frequencies. We use channels at 19, 22,37 and 85 (or 91) GHz frequencies in vertical polarization. There is no 22 GHz channel in the horizontal orientation. Looking along the X axis (frequency) for the various channels, you notice offsets were greatest at the low frequencies and less at the high frequencies. Since the wetness value is directly dependent on this differential in temperature across the frequencies, the increase difference increases the wetness value. The relationship is non-linear, so wetness increases exponentially to the increase in the gradient. Which means that the improved calibration will have the greatest impact on higher wetness values.
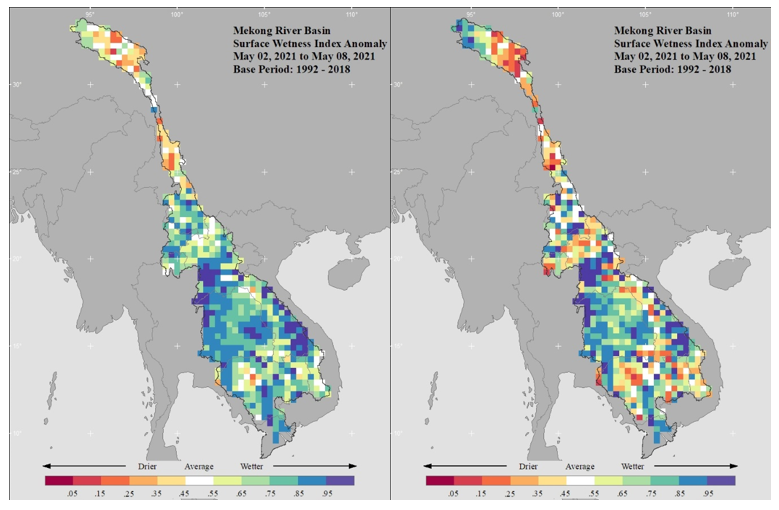
The difference from the improvements is illustrated in surface wetness anomalies. The comparison is presented for the week of May 2-8, 2021 over the Mekong basin. The image on the left includes morning overpass observations and a wetter surface, compared to the image on the right, which is based on afternoon only overpasses. The general fields are similar, yet the spatial structure is considerably different. The image on the right is more detailed and accurate.
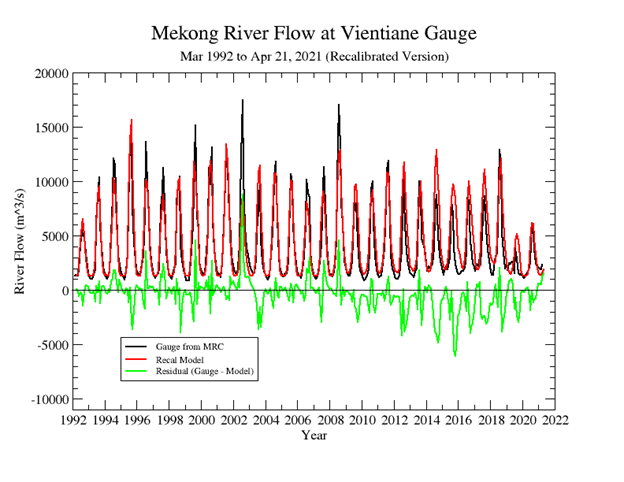
As a result of refinements in the wetness index (i.e. ascending only and new inter-calibration values) the flow models were regenerated, and the corresponding time series of gauge and predicted natural flow were produced for the period of record. The revision was performed for both the Chiang Saen and Vientiane gauges. The new Chiang Saen model has an R2 of 0.91, standard error of 464 cubic meters during the calibration period (1996 to 2001). It has the same RMSE of 467 cubic meters/ second for the validation period (2004 to 2009). For the Vientiane model the R2 is 0.89 and the standard error is 785 cubic meters during the calibration period from 1996 to 2001, and the RMSE of 712 cubic meters/ second for the validation period (2004 to 2009). There is no significant difference in the RMSE during the calibration and validation period. Both models have weighted leads time, starting with the wetness upstream and a delay when the water arrives as flow downstream. These lead times span several months. The month prior to the current gauge measurements has the most weight, since it takes time for the water to flow through the soil and down the basin to reach the main stem of the river. Both models have quadratic functional forms between wetness upstream and river flow at the gauge. There is no significant difference in the RMSE during the calibration and validation period. Moreover, at Vientiane the RMSE is lower in the validation period, compared to the calibration period. The strength of the model and their robustness is validated by the similar RMSE in a different decades. These findings demonstrate the models are not over specified and there is stationarity between the relationship of wetness values upstream and predicted flow at the gauge downstream.
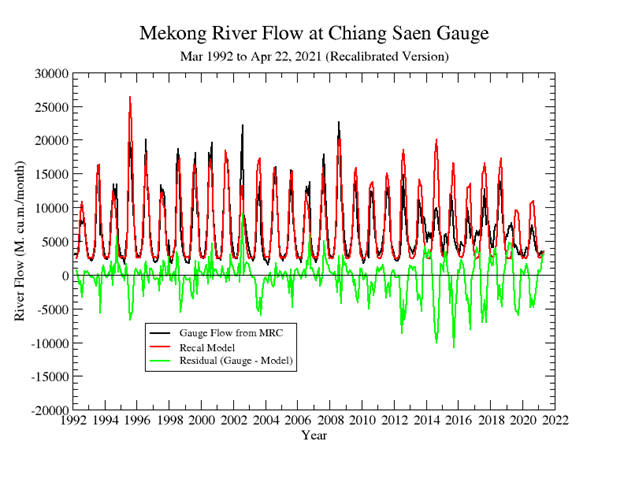
The comparison between the Chiang Saen initial time series and image below portrays how we resolved the issue of excess water and better represent the natural flow. These findings will support near real time monitoring on the impact of dams, climate change and inter-annual variability in the Mekong basin. We look forward to continue (and improve) our work and plan to apply the finding to the benefit of the communities impacted by the Mekong basin.
As in the last figure, below is the Vientiane series using the new inter-calibration adjustments. This is the first extension of the Mekong Flow Model downstream. In the near future, there will be an update using higher resolution data to more accurately measure the Wetness across the Mekong River Basin.
We would like to thank a blogpost authored by Aalto University researchers and follow-up conversation with those authors was most helpful to us. Our partners at the Stimson Center also have provided constant support and meaningful dialogue through the process. We have also engaged frequently with advisory board members who have provided very useful feedback to process improvement. Rafael Schmitt from Stanford University stands out as a major contributor to the improvements, and we are grateful to his support.
Comments